Options
RAPIDMINER PCA QUESTION
I would like to do a principal component analysis of the taste of ramen.
If I have a score for each noodle(면), the shape (size) of the ramen bowl(그릇), and the taste of the broth(국물), let's perform a PCA analysis with three variables (noodle, bowl, broth).
THIS IS EIGENVECTORS

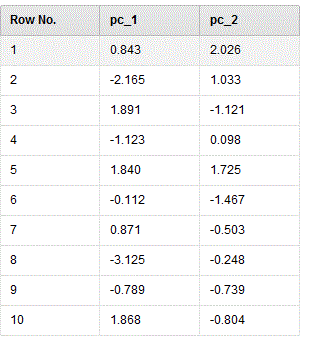
THIS IS EXAMPLE SET PCA DATA
THIS IS EIGENVALUES

THIS IS READ EXCEL EXAMPLE SET DATA

I tried to draw a graph after getting the PCA, but I'm not sure if the graph is correct.
In addition I don't know what the PCA represents. How can I interpret the graph? Can you help me?

1
Best Answer
-
Options
 yyhuang
Administrator, Employee, RapidMiner Certified Analyst, RapidMiner Certified Expert, Member Posts: 364
  RM Data Scientist
Hi @yunni,
Thanks for coming along and sharing your use case! When we use PCA, usually we have lots of variables (most of the time -- much more than 3 variables) and that we want to reduce the dimension. So we use PCA to extract from N-dim, and map the original variables into another new feature space, and get independent representative components in the new feature space.
How do I use PCA results? 1. Feature elimination (as described above) 2. Feature Selection 3. Build new classification or clustering models based on the new feature space (principle components)
If you have used "weight by PCA" operator in RapidMiner, you would know the feature selection by PCA. Just like the eigen-vector table you've shown in the example use case, each variable (noodle, bowl, broth) has individual contribution to the components, the higher of the contribution, the more importance.
The eigen-vector table is usually used for feature weights and feature selections.
When do we make scatter-plots with PC1 Vs PC2? Below is an example of scatter-plot matrix of principle components with color/shape highlighted by classification/cluster label. (copy rights https://www.researchgate.net/publication/280641257_Subgenomic_Diversity_Patterns_Caused_by_Directional_Selection_in_Bread_Wheat_Gene_Pools)
So my questions related to your use case is that do we have any kind of label? Suppose we have label y= overall satisfactory score of Ramen, and x= (noodle, bowl, broth), we can start from the feature weights to see which factor (noodle, bowl, broth) makes more impact to the overall score.
Cheers,
YY12

 Learner I
Answers
Thank you for your kind reply. I'll use "weight by PCA" to get the eigen-vector values and challenge the scatter plot matrix! Can I comment if I have any further questions? It really helped me a lot. Thanks