Why Does Forecast Validation give Larger Price Difference Predictions than Apply Forecast?
SkyTrader
New Altair Community Member
Hi there,
When the Dow Jones can regularly move 100's of points a day, the Forecast Validation operator appears to reflect this real price movement a little better and closing price differences range by about 30 points (pls see first image), whereas when I use the Apply Forecast operator it gives near flat line future predictions with virtually little or no change in price from the previous days bar a few points, which is of little use?
One explanation I've heard is that the the best forecast is just a flat line because there is no proper pattern in the data, and the zig-zag in my input data is just noise which cannot be predicted. My open/high/low/close data does also include many technical indicators including exponential smoothing. (No Fourier Transform has been done on this time series as I had trouble hooking up that operator using a working FFT process).
If this is the case I was wondering why is the Forecast Validation operator producing what appears to slightly more valid and price movements?
Here is the ARIMA Forecast Validation results (without the Apply Forecast)

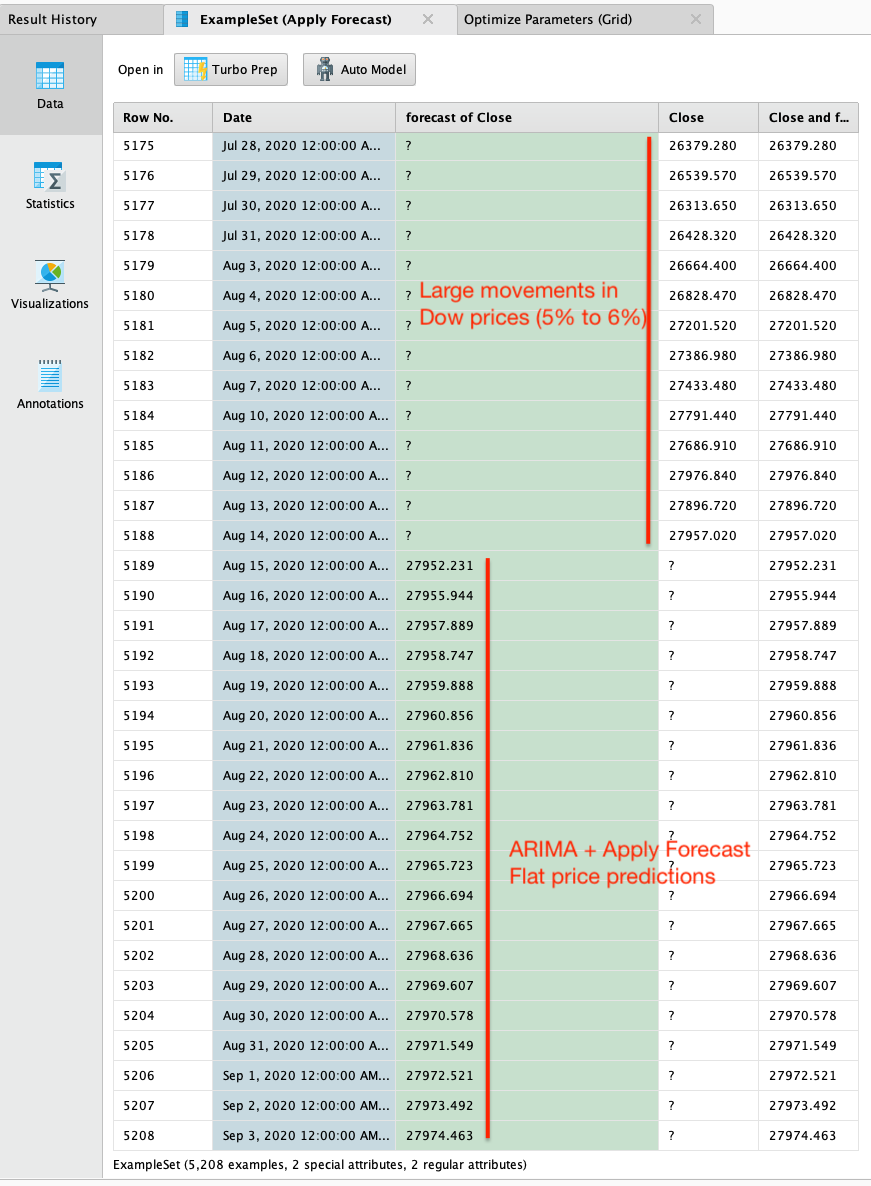
The second image shows the Dow moving 5.5% over a 14 day period but with flat future price projections from Apply Forecast:

As can be seen the Apply Forecast doesn't move much from 27,950 to 27,970 but this certainly wasn't the reality with the Dow price range during the same period -- mid August to the beginning of Sept 2020:
(I tried different ARIMA p,d and q, values that made little difference).

What can I do to make it more useable for predicting actual future prices? I have an example here using Window = 2500, Step = 30 and Horizon = 5 during the Covid crash where predicted prices were realistic in capturing the large changes between consecutive closing prices of the Dow:

Many thanks,
When the Dow Jones can regularly move 100's of points a day, the Forecast Validation operator appears to reflect this real price movement a little better and closing price differences range by about 30 points (pls see first image), whereas when I use the Apply Forecast operator it gives near flat line future predictions with virtually little or no change in price from the previous days bar a few points, which is of little use?
One explanation I've heard is that the the best forecast is just a flat line because there is no proper pattern in the data, and the zig-zag in my input data is just noise which cannot be predicted. My open/high/low/close data does also include many technical indicators including exponential smoothing. (No Fourier Transform has been done on this time series as I had trouble hooking up that operator using a working FFT process).
If this is the case I was wondering why is the Forecast Validation operator producing what appears to slightly more valid and price movements?
Here is the ARIMA Forecast Validation results (without the Apply Forecast)

The second image shows the Dow moving 5.5% over a 14 day period but with flat future price projections from Apply Forecast:

As can be seen the Apply Forecast doesn't move much from 27,950 to 27,970 but this certainly wasn't the reality with the Dow price range during the same period -- mid August to the beginning of Sept 2020:
(I tried different ARIMA p,d and q, values that made little difference).

What can I do to make it more useable for predicting actual future prices? I have an example here using Window = 2500, Step = 30 and Horizon = 5 during the Covid crash where predicted prices were realistic in capturing the large changes between consecutive closing prices of the Dow:

Many thanks,
0
Answers
-
Hi SkyTrader, I don't think you will get more out of Arima on this problem than you already have. There might not be a way to reduce your error to something acceptable.
regards,
Alex0 -
The purpose of the Marshalls Customer Satisfaction Survey is to collect honest and genuine feedback as possible from the customers of Marshalls.
-1 -
Hi @hughesfleming68,
I was using an ARIMA process Martin kindly posted for me -- pls see below -- the relative errors were acceptable at around 1% to 2% but the predictions are flat compared to the previous closing prices, is that "typical" of ARIMA?Pls see attached file ARIMA Martin Optimised:Using a non optimised ARIMA process I have had results (and graphs) that showed that ARIMA was predicting the market well BUT never beyond the last date of my dataset (14th Aug 2020), I don't know how to get it to predict beyond the 14th Aug 2020? Pls see attached file ARIMA Non Optimised:
Any insights into why this is would be gratefully appreciated.
I haven't yet coded John Ehler's indicators into Excel yet but have already used detrending and smoothing in this data set along with a number of technical indicators (RSI/ADX/Stochastics/ATR etc).Cheers,
0


