
Options
Explain Predictions interpretation for regression
 christos_karras
Member Posts: 50
christos_karras
Member Posts: 50
I have been experimenting with visualization of the results of the Explain Predictions operator. My objective is to evaluate if it could be used as a tool to investigate cases where the model was wrong, by finding which variables contributed the most to the error. The error is defined as the difference between the actual value and the predicted value. However I'm not sure how to interpret the values returned by Explain Predictions.
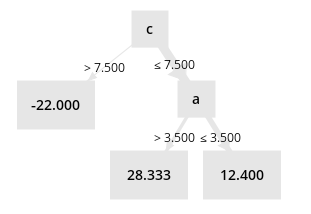
To help understand, I built a simple example with a simple data set that trains a decision tree and tries to explain its prediction. But I don't understand in this example how it decides which attributes "support" the prediction and which ones "contradict" it.
Output of the Explain Predictions "vis" port:

Examples I'm trying to understand:
* In example 7 and 8, why is column "c" considered to be contradicting the prediction? If we follow the path in the decision tree for this example, we get to the value of the prediction (28.333 for example 7, -22 for column 9), so shouldn't this support the prediction?
* In the first 4 examples, why is b considered to be supporting the prediction, but not a or c?
Also, I noticed that the "imp" output port doesn't take in consideration the "maximal explaining attributes" parameter (it always returns all attributes for all examples). Is there a way to limit it? As a workaround I built a process that uses the outputs of the "exa" port and parses the string values of the "Support Prediction" and "Contradict Prediction" columns to get this information but limited to the top supporting/contradicting attributes for each example. Is there a simpler solution I didn't see?
To help understand, I built a simple example with a simple data set that trains a decision tree and tries to explain its prediction. But I don't understand in this example how it decides which attributes "support" the prediction and which ones "contradict" it.
Output of the Explain Predictions "vis" port:
Examples I'm trying to understand:
* In example 7 and 8, why is column "c" considered to be contradicting the prediction? If we follow the path in the decision tree for this example, we get to the value of the prediction (28.333 for example 7, -22 for column 9), so shouldn't this support the prediction?
* In the first 4 examples, why is b considered to be supporting the prediction, but not a or c?
Also, I noticed that the "imp" output port doesn't take in consideration the "maximal explaining attributes" parameter (it always returns all attributes for all examples). Is there a way to limit it? As a workaround I built a process that uses the outputs of the "exa" port and parses the string values of the "Support Prediction" and "Contradict Prediction" columns to get this information but limited to the top supporting/contradicting attributes for each example. Is there a simpler solution I didn't see?
Tagged:
1
Best Answer
-
Options
 varunm1
Moderator, Member Posts: 1,207
varunm1
Moderator, Member Posts: 1,207  Unicorn
Hello @christos_karras
Unicorn
Hello @christos_karras
Actually, the comparison here is not between the global model and attributes. The attribute importances are based on local correlations. Global importance might not match with local importances.
First, the algorithm used in explain predictions will generate samples closer to each example (Based on a concept in LIME). Then a correlation is taken between the attributes and output (Correlation weights are calculated). This way based on correlation weights, the supporting and contradicting attributes are decided for each example. The attributes with positive correlations are categorized as supporting and others with negative correlations are categorized as contradicting.
You can observe these correlation weights in "Exa" output port of explain predictions and also.
The maximal attributes option will restrict the number of attributes that are displayed in "Exa" output of explain predictions.
@IngoRM might add more here.
Regards,
Varun
https://www.varunmandalapu.com/Be Safe. Follow precautions and Maintain Social Distancing
7
Answers