
The Altair Community and the RapidMiner community is on read-only mode until further notice. Technical support via cases will continue to work as is. For any urgent requests from Students/Faculty members, please submit the form linked here.
Options
Weird (for me at least) ROC curve

Hello!
I'm working on a decision tree and, performance-wise, it works great - accuracy is 99.59%.
In the performance module I selected also AUC (neutral), to check the ROC curve, and here it is:
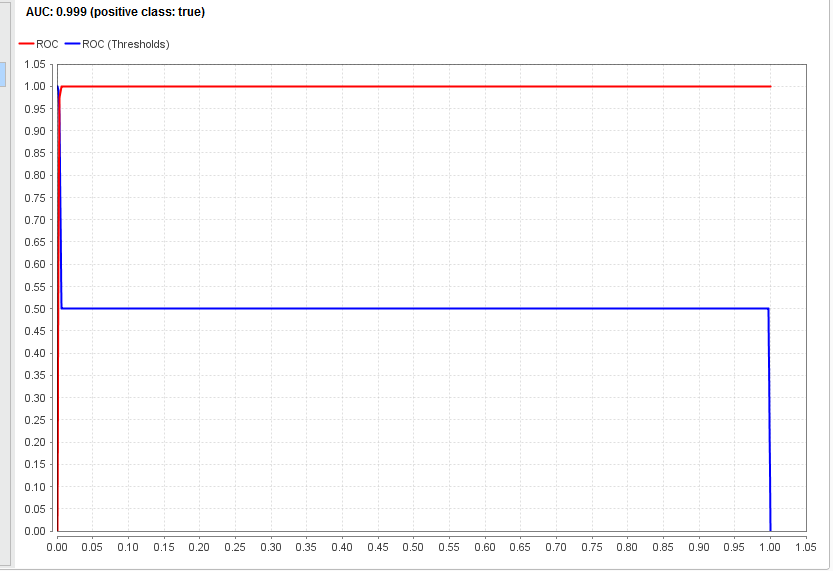
Now, question is: being accuracy 99.59%, I understand the red curve - almost a perfect fit. But what about the blue one? Is it like the straight diagonal line for the ROC used for regression?
Thank you!
I'm working on a decision tree and, performance-wise, it works great - accuracy is 99.59%.
In the performance module I selected also AUC (neutral), to check the ROC curve, and here it is:
Now, question is: being accuracy 99.59%, I understand the red curve - almost a perfect fit. But what about the blue one? Is it like the straight diagonal line for the ROC used for regression?
Thank you!
Tagged:
0